
DEQ Support Helps RiverNET Maintain Data Quality
One of RiverNET’s goals is to increase the frequency of water quality sampling using in-house tools to analyze samples more quickly and for less money than traditional lab work.
But how do we know that these tools, called colorimeters, are delivering precise and accurate results?
To find out, we need to compare our data to a second dataset from samples that were collected at the exact same locations at the exact same times, were handled in the exact same way, and tested for the exact same parameters. The only difference in this second dataset is that the testing is done by a different lab or using similar but different equipment. This is called validation data. It is critical for pretty much every science project, not just RiverNET, because it can be used to calibrate and correct for minor variation in the data and, importantly, it helps ensure scientific credibility through quality assurance/quality control.
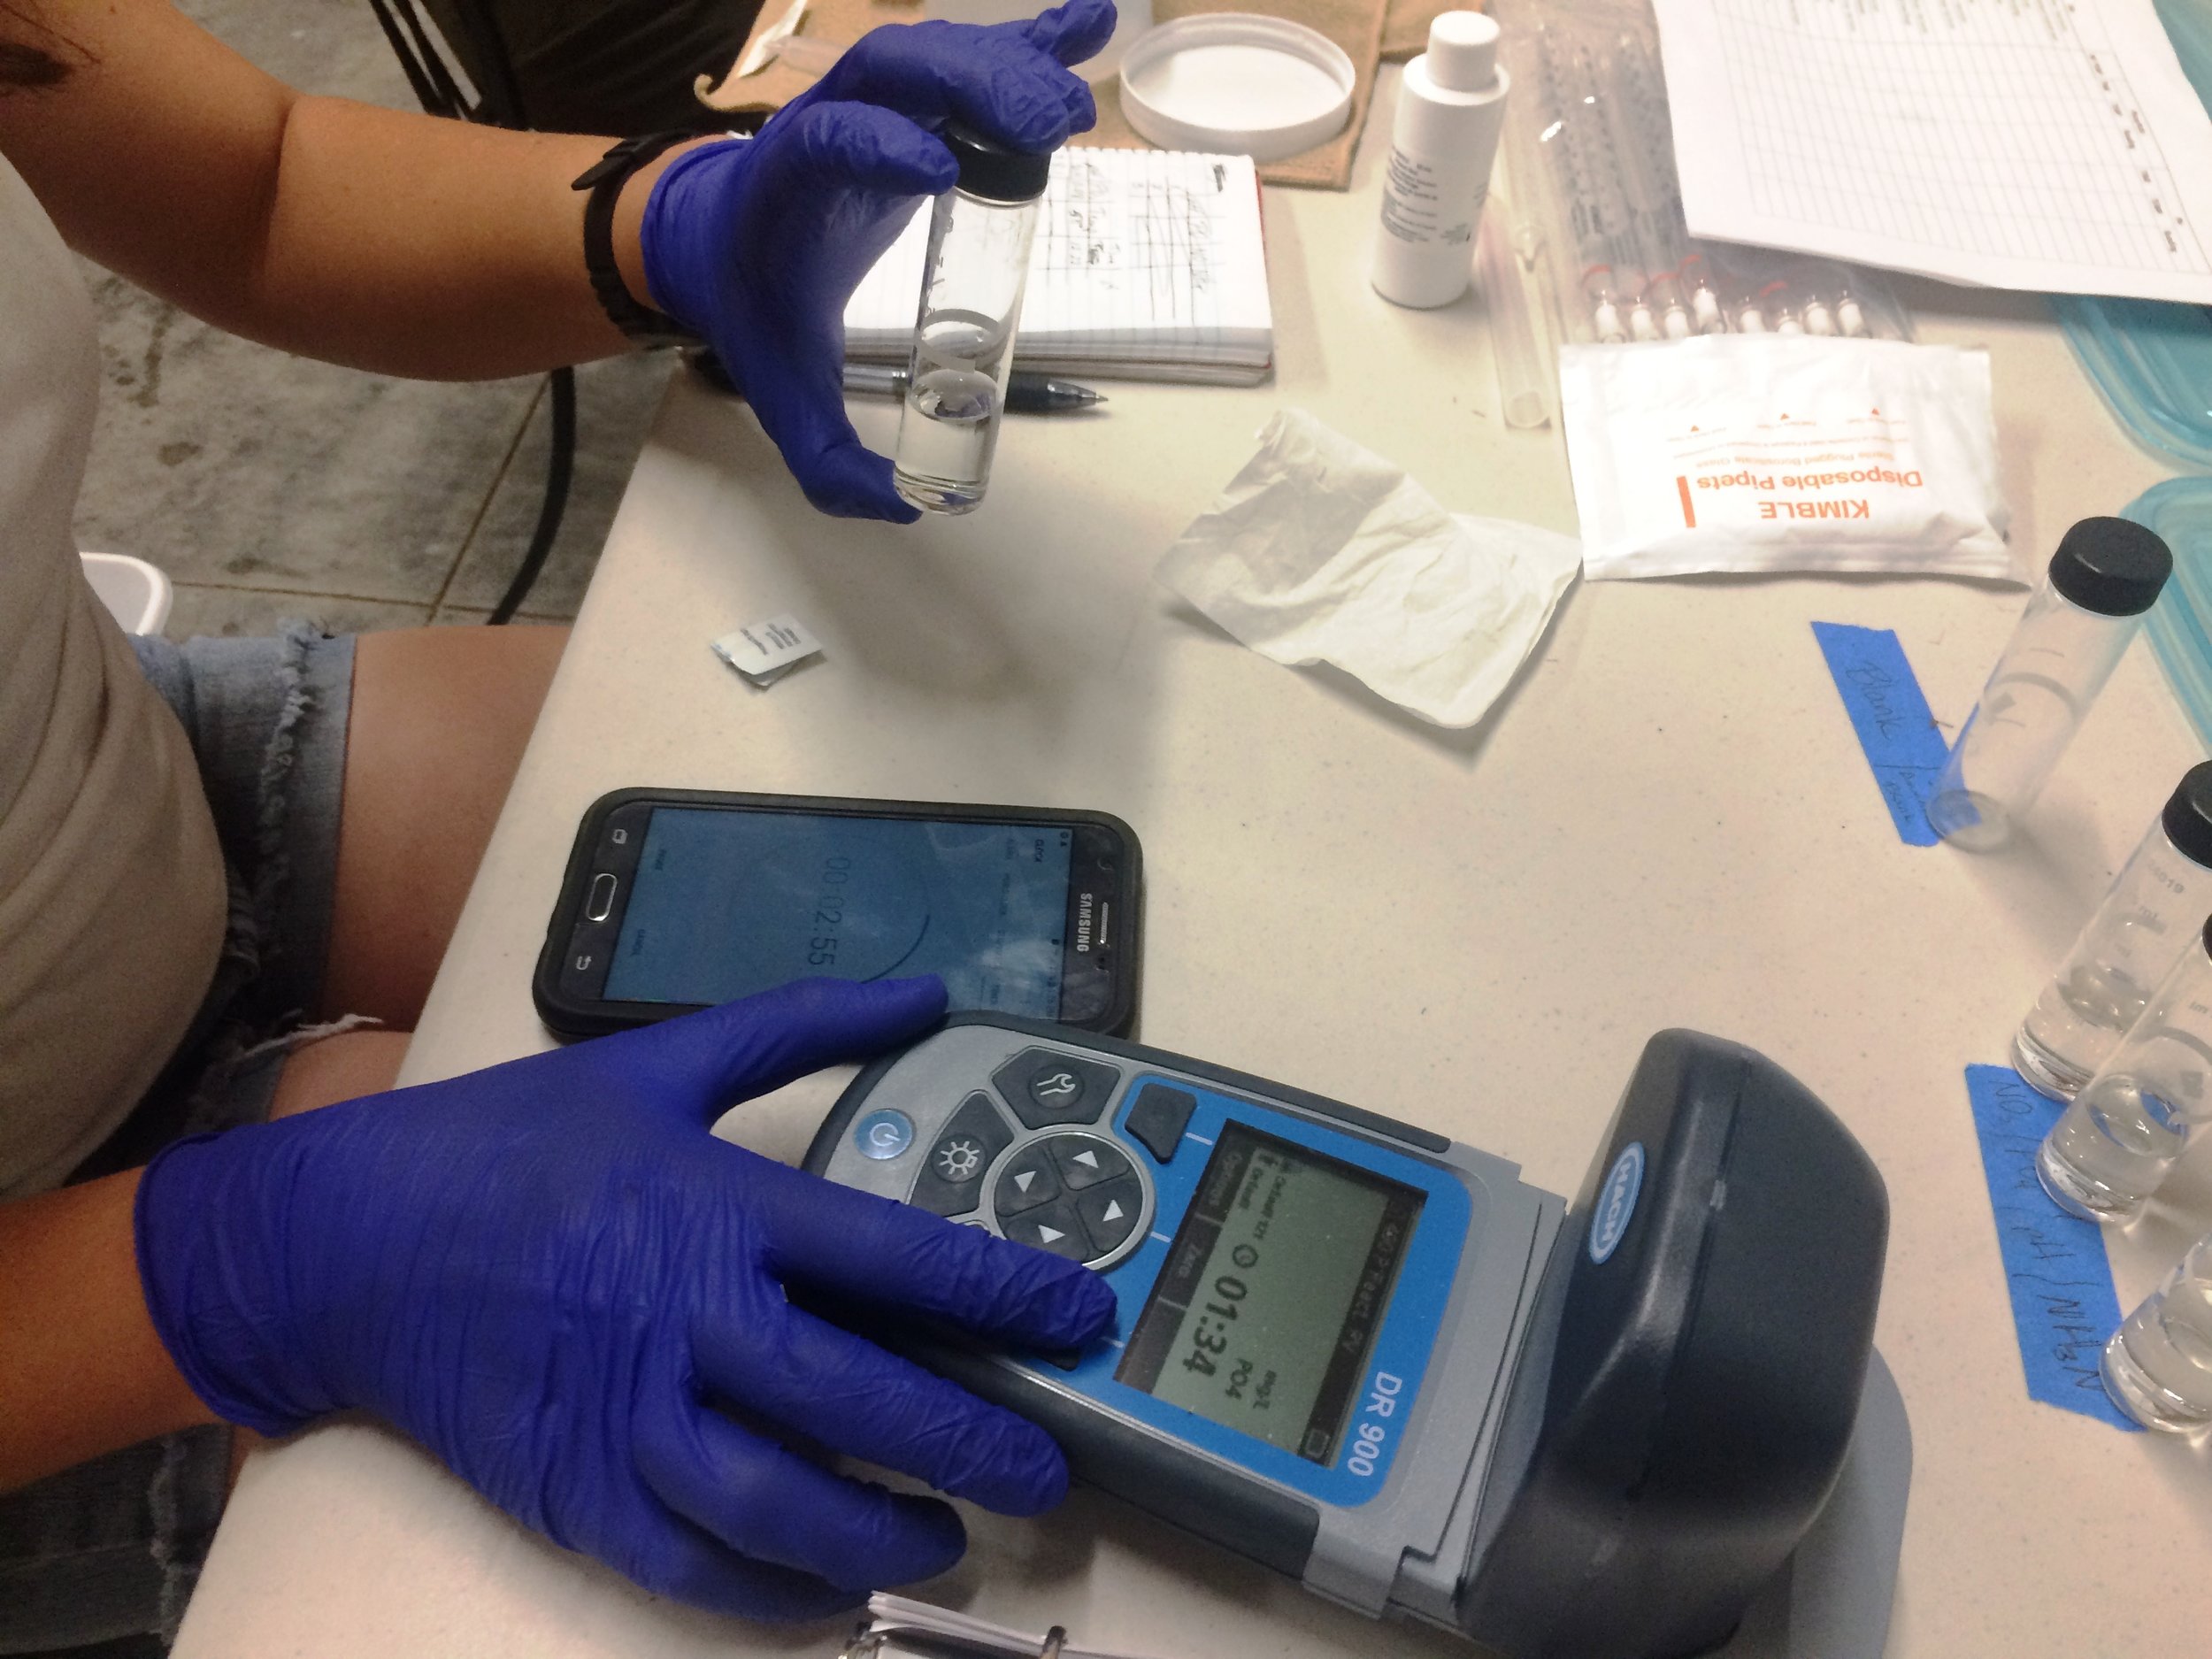
So how is YERC collecting validation data to assess our Hach DR900 colorimeters – which estimate the concentration of a given nutrient by measuring the color of the sample following a color-changing chemical reaction driven by the nutrient – and the water quality data we are producing for the Upper Yellowstone River Watershed?
This spring, YERC was awarded $2,500 from the Montana Department of Environmental Quality’s Volunteer Monitoring Lab Analysis Support Program for assessing duplicate samples at the certified water quality lab where they send their samples, Energy Labs in Helena. We are collecting duplicates during three seasonal events: (1) Pre-Growing Season (spring runoff), when nutrient levels are expected to be at their annual highs due to the muddy water, (2) Growing Season (mid-summer), when both the chance of water pollution from agricultural and residential sources as well as the ability of growing plants to remove those nutrients from the water is greatest, and (3) Post-Growing Season (fall), when water levels are at their annual lows. Under these different conditions, this dataset gives us the annual range of values we should expect to see in our results.
Not only did we receive this much needed financial support to accomplish the critical objective of validation data, we also received a very thorough review of our Sampling and Analysis Plan, which you can also find on the bottom of our RiverNET page. That review process was, at times, more intensive than you might expect for a graduate thesis defense or even a manuscript submitted to a peer-review journal, but it was well worth it as we got a lot of great critique and feedback on our plan, not to mention the lab work and the agency’s support.
So now how are we going to use this validation data, and what will we do if we find that our results are off?
This winter, we will perform statistical analyses to assess the precision of our results (does the range of values from repeat tests fall within the manufacturer’s reported accuracy window, as in, are we continuing to hit the same target with each repetition?) and the accuracy of our results (does the validation data fall within that window as well, as in, are we both hitting the same target?). If we find that our data in not precise, then we will look to our own methods and protocols to see if there are any inconsistencies or issues there. If we find that our values are off, but off by a consistent amount, then we may be able to correct for that consistent difference. And if our values are off and there is no telling why, well, then it’s back to the drawing board.
Would this latter, worst-case scenario be a sign of failure? No! Ensuring data quality, and maintaining a healthy skepticism of the data and methods even when things seem to be going well, are essential parts of the scientific method. And thanks to DEQ’s support, we are able to do both for RiverNET.
Patrick Cross is YERC’s research director and RiverNET project manager

Click here to view the rest of our Sampling and Analysis Plan