YERC Interprets This Summer's RiverNET Results

Our Total Phosphorus results show consistency for individual sites over time, indicating that our crews conducted sampling and analysis procedures with consistency and precision. But they also show differences in average levels between tributaries of the Yellowstone River on its west bank and tributaries from the east. Can the geology of these tributaries’ headwaters explain the differences, or is something else going on here?
As we wrap up water quality monitoring for 2019 and look back on the data we’ve collected over the summer, we are pleased with what we are seeing:
Our results, from sample site to sample site and from sampling event to sampling event, are relatively consistent, just like we would expect them to be when monitoring the natural background levels present in the water (barring a severe storm, point source pollution release, or some other dramatic event that would cause a spike).
The variance in results from replicate analyses of the same sample (which we do for randomly selected samples from each sampling event, for our own quality control/quality assurance measures), shown by the black lines in the data plots, generally fall within the analysis method’s published accuracy range, shown by the gray lines in the data plots, indicating good precision in our own analyses.
Also, the length of those black lines generally decrease over the course of the season, indicating that the variance decreased through an increase in precision, evidence that our crew has improved how they collect, handle, and analyze the samples throughout the season.
Data we collected from the Yellowstone River at Corwin Springs in 2019 fall within the range of values reported for the same site by the USGS with data collected from 1999-2001.
With the support of the Montana Department of Environmental Quality, we’ve started to collect additional high quality validation data, to both supplement this previous USGS study, establish more recent baseline values 20 years later, and validate the data we are collecting with our less expensive, less time-consuming, but also less sensitive methods.
Some patterns are emerging demonstrating expected trends, such as a spike in nitrogen concentrations early in the season corresponding with spring runoff, or differences in phosphorus levels corresponding with differences in the local geology (see above).
These initial patterns are prompting new questions and hypotheses to be tested. For example: why did Nitrate+Nitrite values spike in early July while Total Nitrogen values (which include Nitrate+Nitrite as well as ammonium) didn’t spike until late July (see below)? If the spike was purely due to erosion during spring runoff, we would’ve expected the spikes to occur at the same time: is the difference something to do with natural processes in the soil, since ammonium levels should increase as organic matter in the soil decomposes? Or does it have to do with fertilizer application in surrounding ag lands, since ammonium is a key ingredient in fertilizers? Or is it evidence of septic contamination since the spike occurs during peak tourist season? Or is there some other explanation(s) all together? And what about those higher phosphorus levels on tributaries that enter the Yellowstone from the west compared to those that enter it from the east: does geology alone explain this difference (the western tributaries originate in the volcanic Gallatin Range, while the eastern tributaries originate in the granitic Absarokas), or are we missing anything here? New questions like this can be addressed by examining correlations in the existing data, designing additional sample collection studies to test specific hypotheses, and other means… importantly they are just a part of (as well as evidence of) good science.

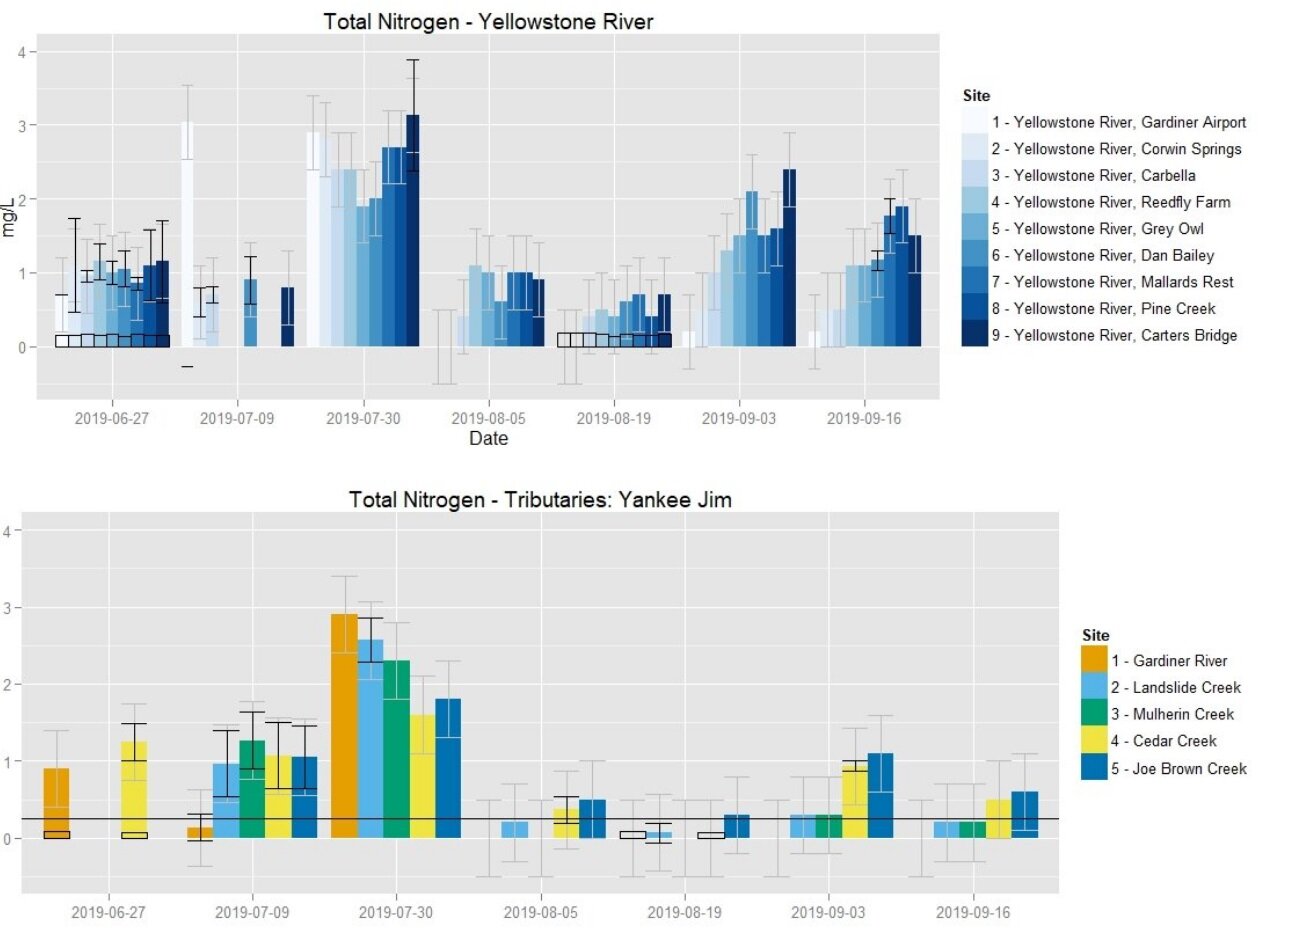
As expected, we saw a spike in nitrogen concentrations early in the season, corresponding with spring runoff. But the Nitrate+Nitrite concentrations were highest in early July, while the Total Nitrogen concentrations were highest in late July. Why not at the same time? The natural product of soil ecology, an evidence of human impact, or something else?
So, in short, this year’s results demonstrate that we are executing the methods we’ve developed over the last two years with consistency and high precision. As scientists launching an ambitious, complex, politically sensitive, and (quite frankly) new monitoring project (at least for us at YERC and the Upper Yellowstone community in general), these results in themselves are tremendously satisfying, especially considering the obstacles overcome in our 2018 pilot year. For example, early on we noticed wide variance in our phosphorus results, discovered a cross-contamination issue, revised our equipment cleaning protocols to include phosphate-free soaps, and solved the problem. Or at least we thought we did…
These results also show some issues with our data, nothing that is particularly surprising, disconcerting, or unfixable, but still issues that need to be considered when interpreting these data, and addressed as we refine and improve the project in coming years. Specifically:
Our Total Nitrogen and Nitrate+Nitrite results are consistently an order of magnitude (i.e., 10 times) greater than the results from our validation data produced at an independent lab. Again, the consistency is a good thing as it indicates (a) our crew is properly conducting the analyses following the manufacturer protocols, and (b) the issue can possibly be corrected through calibration. Plus, despite the apparently wide difference in these results, they both generally fall within the accuracy range of our equipment, indicating that the issue has more to do with the low sensitivity of our equipment and the low levels being detected than with any problems with our procedure.
Aware of the trade-off between sensitivity and cost and turnaround time with our equipment, our goal was for it to show general trends and detect spikes signaling the need for more intensive study. But the low sensitivity seems to obscure a trend that we detected in 2018 and see again in our August 19, 2019 validation data showing increased Nitrate levels (albeit not to the point of stream impairment) in the Yellowstone River sites closest to Gardiner that dissipate farther downstream. This might suggest that our equipment is insufficient to show trends in such low ambient levels (but it might still work for detecting spikes).
That low sensitivity/wide accuracy range can cause problems for folks interpreting the data, however, since that accuracy range might straddle the Base Numeric Nutrient Standards that DEQ uses to monitor stream health: without considering the equipment’s accuracy and other QA/QC measures, the results can be misconstrued to suggest levels exceeding the state’s standards.
Although our last round of Orthophosphate validation data showed that our in-house results were generally accurate as well as precise, the corresponding Total Phosphorus validation showed that none of our in-house results were accurate, despite evidence of precision through our in-house replicate sampling (see below). Perhaps we didn’t solve that cross-contamination issue last year after all? This month, we will conduct an experiment assessing phosphorus from samples collected at the same site and at the same time, but with equipment that had been cleaned in different ways. Hopefully that will identify the problem and, even better, a solution.
And in addition to addressing these issues, we also have more work to do:
Integrating our water quantity data from our stream gauges, since the volume of water affects nutrient concentrations and thus water quality.
Improving our data visualization tools, adding interactive features without letting users get themselves twisted up in confusing, uninterpretable, or misinterpretable plots, and also streamlining and automating new data uploads from the back end.
Better using and displaying volunteer data. We’ve developed some new ideas for using volunteer data in our QA/QC process, as well as ways that volunteers can look at the dataset, see their contributions, and say, “that’s my data!”, that we are excited to start implementing next year.
Considering that this project is just finishing its second season, we’d still say that an impressive amount of work has been done, and that none of the problems identified are insurmountable (plus, recognizing the problems in the first place is the first step towards fixing them).

In June (red circle), our Total Phosphorus results (blue bars) were consistent with those from samples we sent to an independent lab for validation (black outlined clear bars). But in August (red square), our results were much greater than the validation data. What might have happened in between? We suspect cross-contamination from residual phosphates left over after our cleaning process, and have a plan to test this hypothesis…
But what does all this tell us about water quality in the Upper Yellowstone River Watershed? After all, that’s why we are doing all this work, right?
Well, at this point, it doesn’t tell us all that much: we need to continue collecting data over several more years, including years with snowy winters and cooler summers, dry winters and warm summers, spotty winters and rainy summers, etc., in order to adequately show natural baselines and the natural range of values we should expect to see. We also need to address the issues mentioned above, by either refining procedures, calibrating results, or eliminating and/or changing some procedures all together.
Yet given the low levels we detected across all parameters, both in the independent validation as well as the overestimates produced by our in-house methods, we can say that water quality is generally good across our sampling sites in the Upper Yellowstone River Watershed.
That’s good news!!!
So why then should we continue monitoring if things are already looking good???
We need to continue monitoring because conditions may change as climate, land-use, urban development, recreation, etc. changes in the Valley. And if we don’t know what things should look like under healthy conditions, we might not notice negative changes as they happen. And we definitely won’t notice them if we aren’t looking. That’s why we need to celebrate RiverNET’s initial successes, continue addressing its “growing pains”, and keep working together to develop a program that benefits the Upper Yellowstone in the long run. In the meantime, you can help us make these improvements by supporting RiverNET – either with your time, your money, or both – and, importantly, by studying the data, contacting us and asking questions, and learning how to not only correctly interpret these data for yourself, but also communicate these results and your own ideas about them to your friends and neighbors.
Patrick Cross is YERC’s research director and the RiverNET project manager